The hardest part of a technology migration is rarely finding the line that declares a version. It is understanding everything that line can influence. A runtime update can change a native dependency, which alters a container build, which delays a shared package release, which blocks six services owned by four teams. A database upgrade can affect drivers, queries, connection pools, backup tooling, analytics jobs, and disaster recovery. Without an impact map, these relationships appear one at a time during execution, usually when they are most expensive to discover.
Blast-radius mapping makes those relationships visible before the program commits to dates. The result is not simply a dependency diagram. It is an evidence-backed model that connects a proposed change to code, configuration, deployables, data paths, delivery controls, business capabilities, and people. It shows where change must occur, where validation is required, where coordination will be difficult, and where one failure can propagate. This guide explains how to build that model and turn it into an execution advantage.
Define blast radius as reach plus consequence
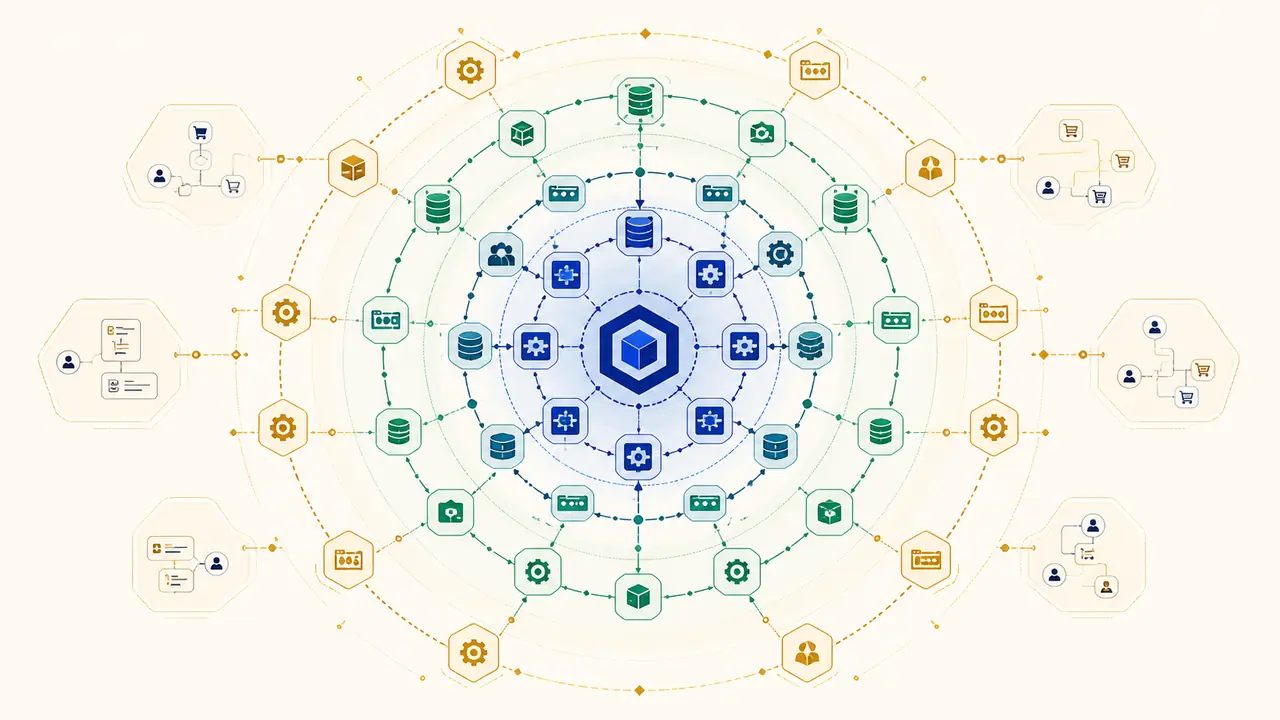
Teams often use “blast radius” to mean the number of repositories containing a technology. That count is useful but incomplete. Ten low-traffic tools with independent deployments may present less risk than one shared authentication library consumed by every public service. A meaningful blast radius combines reach—the nodes and relationships touched by a change—with consequence—the operational or organizational cost if one of those paths fails.
Reach includes direct users, transitive consumers, generated artifacts, runtime environments, pipeline stages, and downstream contracts. Consequence includes service criticality, data sensitivity, recovery difficulty, traffic concentration, regulatory obligations, and coordination cost. A map should preserve both. If it collapses them into one color or a single risk number, engineers cannot see whether a high rating comes from broad exposure, severe impact, weak evidence, or all three.
A useful blast-radius question
If this component changes behavior, fails to build, or cannot deploy on the target technology, which artifacts, services, teams, customer journeys, validation gates, and recovery paths are affected—and what evidence establishes each connection?
Set the purpose of the map before collecting data. An executive portfolio view needs aggregation by program, team, and criticality. A staff engineer sequencing work needs package-level and deployment-level paths. An incident-ready cutover view needs traffic routes, health signals, rollback dependencies, and decision owners. These are different projections of the same underlying model, not separate spreadsheets.
Model the change event precisely
Every impact analysis begins with a defined change. Record the source state, target state, affected technology surface, compatibility assumptions, and intended rollout model. “Upgrade JavaScript” is not actionable. “Move production services from Node.js 18 on Debian-based x86 images to Node.js 22 on the same image family, retaining CommonJS and the current package manager” creates a boundary that rules and reviewers can evaluate.
Technology transitions often contain multiple coupled changes. A framework upgrade may also require a compiler update, module format change, routing behavior change, and hosting configuration change. A database major version may introduce extension changes and operating-system requirements. Represent each change dimension explicitly. This allows the map to show that a repository is affected by the runtime target but not by the module conversion, or that a service is technically compatible yet blocked by a platform image.
Anchor the source state to immutable revisions. For repositories, record commit identifiers. For images, use digests. For infrastructure modules and deployment configuration, capture versions and environment-specific overlays. For managed services, record observed configuration and version at a known time. A moving source produces findings that cannot be reproduced and makes progress impossible to measure.
Write exclusions next to scope. If development-only tools, archived services, forks, mobile clients, or third-party systems are outside the program, state why their connections do not create material exposure. An exclusion without reasoning is a hidden assumption. Revisit exclusions when the graph reveals a dependency path crossing the boundary.
Build a typed, evidence-backed impact graph
A useful graph represents different kinds of nodes and edges. Repository, workspace, package, application, service, database, queue, pipeline, image, environment, team, and business capability should not be interchangeable boxes. Their types determine which questions can be answered. Likewise, “imports,” “publishes,” “deploys,” “reads,” “writes,” “calls,” “owns,” and “validates” describe different forms of coupling.
Start with repository discovery. Parse workspace definitions, manifests, lockfiles, module imports, build configuration, container files, CI workflows, infrastructure definitions, ownership files, and test configuration. Use platform metadata to connect repositories to deployments and teams. Supplement static evidence with runtime catalogs, service discovery, tracing, deployment records, or architecture registries where available. Static and operational views often disagree; that disagreement is itself a finding to resolve.
Every edge needs provenance. An application may depend on a package because its lockfile resolves it, a source file imports it, or a runtime trace observes it. These signals have different meanings and confidence. Store repository, commit, file or configuration path, parser or rule version, observed value, and collection time. When an edge comes from human confirmation, record who confirmed it and when it should be reviewed.
Preserve direction. If service A calls service B, the migration may affect A as a consumer, B as a provider, or both depending on the changed contract. If package P is published by repository X and consumed by repositories Y and Z, upgrading X before its consumers may be necessary, but releasing a breaking version too early can also disrupt them. Direction enables dependency-aware sequencing and identifies central components.
- Use node types that distinguish source, artifact, deployable, environment, data store, team, and capability.
- Use edge types that explain the relationship rather than a generic “connected to” label.
- Attach commit-pinned evidence and a confidence state to every material relationship.
- Keep direct, transitive, inferred, observed, and human-confirmed connections distinguishable.
- Allow the graph to show unknown ownership or unresolved endpoints instead of dropping them.
Trace package dependencies beyond direct manifests
Direct dependencies are the easiest part of the blast radius. Lockfiles reveal the resolved transitive graph, including duplicates and platform-specific packages. Workspace relationships reveal internal packages that may never enter a public registry. Import analysis distinguishes an installed dependency from a used dependency. Published package metadata shows whether consumers outside the current repository can receive a changed artifact.
For each affected package, walk both directions. Downward traversal answers what the package needs in order to work on the target. Upward traversal answers what will be affected if the package must change. The upward path is especially important for shared internal libraries. A small change in a logging, authentication, database, or API-client package can require coordinated releases across many teams.
Do not stop at package names. Resolve versions per consumer because two services may receive different implementations from the same declared range. Capture overrides, patches, vendored code, forks, alternative registries, and post-install transformations. These mechanisms often encode past compatibility decisions that will become relevant during a migration.
Classify dependency impact. Some components are confirmed compatible and need verification only. Others require a version update, configuration change, replacement, source patch, or manual investigation. Native components may require architecture-specific validation. Unsupported packages may need a strategic decision rather than a technical task. Connecting classification to consumers shows where a single remediation can unblock many downstream nodes.
Follow execution and delivery paths
Source relationships do not reveal the entire operating system. Trace how code becomes a production workload: developer tooling, build jobs, generated assets, package publication, image construction, scanning, deployment configuration, infrastructure provisioning, release orchestration, and traffic routing. A migration can pass application tests and fail because a CI action embeds an older runtime or a minimal image lacks a system library required by a native module.
Map environments separately. Development, pull-request, integration, staging, canary, and production can use different versions, secrets, networks, data services, or deployment paths. Environment parity should be measured rather than assumed. If staging does not carry representative traffic or production-only integrations, its successful deployment reduces only part of the uncertainty.
Follow data and protocol paths. Record databases, caches, queues, object stores, outbound APIs, inbound consumers, and scheduled exchanges. Identify schema, serialization, authentication, timeout, retry, and connection-pooling behavior that could change. Contract boundaries often define the true containment line: if a service maintains its external contract, its internal runtime can change independently; if the contract changes, the blast radius crosses team and release boundaries.
Connect validation assets to the same graph. A contract test should link the consumer, provider, versioned contract, environment, and gate it satisfies. A performance test should link the workload model and threshold. A dashboard should link the production service and rollout cohort it observes. This turns “we have monitoring” into evidence that a specific migration risk can be detected.
Map ownership, coordination, and operational consequence
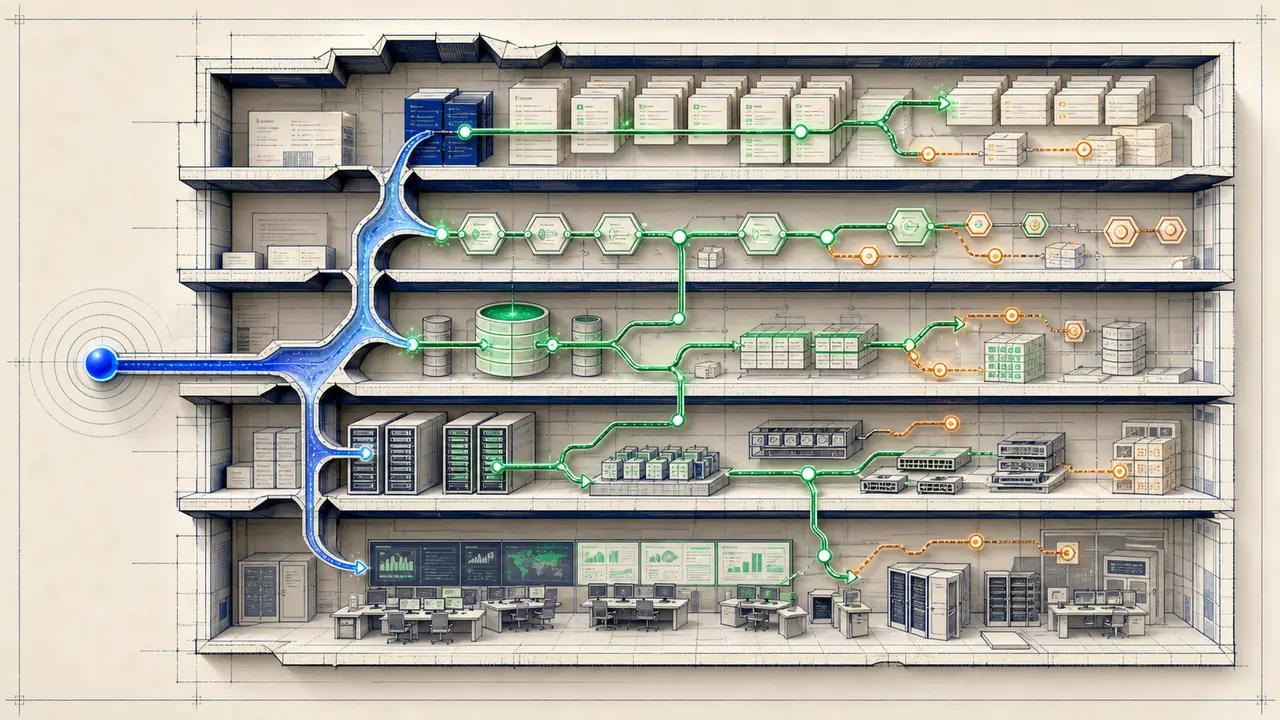
Technology does not migrate itself. Add code owners, service owners, platform owners, security reviewers, release approvers, and on-call teams to the model. Ownership sources can conflict: a repository file may name one team while the service catalog and incident rotation name another. Surface conflicts before execution. A critical node without an accountable owner is a blocker, even if its code is compatible.
Represent criticality and recovery characteristics. Capture service tiers, customer-facing capabilities, traffic, data classification, recovery time objectives, recovery point objectives, maintenance constraints, and change-freeze windows. These attributes affect wave assignment and cutover strategy. A low-code-change service with an irreversible data path may deserve later sequencing and a stricter gate than a larger stateless application.
Look for coordination hotspots. A team owning many central packages may become the program bottleneck. Several services may share one staging environment or one specialist reviewer. Multiple waves may require the same database or deployment platform. These constraints are not visible in package graphs, yet they strongly influence duration and risk. Model them as dependencies or capacity constraints rather than discovering them in scheduling meetings.
Separate evidence, inference, and unknowns
Impact maps inevitably mix high-confidence facts with inference. A lockfile resolution at a pinned commit is strong evidence of a build-time package relationship. A source import is strong evidence of code usage but may sit behind an unused feature. A naming convention suggesting that one service calls another is weak evidence. An architecture document last updated two years ago may be directionally useful but not authoritative.
Assign confidence to nodes, edges, and findings, and explain the basis. Avoid converting confidence into false numerical precision. Categories such as confirmed, strongly inferred, weakly inferred, stale, and unknown are often easier to act on. Then define how each important unknown can be resolved. A trace sample, build experiment, owner confirmation, deployment query, or contract test may upgrade confidence.
Freshness matters independently of confidence. A relationship confirmed last year can be stale today. Store collection time and source revision, and rescan after meaningful changes. Highlight when an assessment mixes repository snapshots from different dates or when an operational inventory no longer corresponds to the code revision. This protects planning decisions from apparently precise but temporally inconsistent evidence.
Do not hide disconnected nodes
An unowned repository, an unidentified runtime, or a deployment with no source link is part of the blast radius until proven otherwise. Visible uncertainty allows a team to investigate it; omitted uncertainty becomes a surprise.
Turn impact into priority and sequence
Once the graph exists, query it for decisions. Identify components directly incompatible with the target, central packages with many consumers, critical services reached through affected paths, unsupported platforms, weak validation zones, and ownership gaps. Group findings by common remediation so teams do not create one task per occurrence when a shared upgrade can resolve many.
Calculate critical paths using dependency order and organizational constraints. Shared libraries and build platforms generally move before consumers. Strongly isolated, observable services make useful pilots. Critical services with broad downstream effects move after the approach has been validated but before temporary compatibility mechanisms become permanent. Sequence around team capacity and release windows, not only graph topology.
Provide views for different decisions. Engineers need file-level evidence and exact dependency paths. Program leads need blocker ownership, wave dependencies, and effort ranges. Executives need exposure by business capability, confidence, and remaining cutover risk. All views should derive from the same data so a status summary never contradicts the implementation plan.
Connect each high-consequence path to validation and rollback. If a runtime can change database client behavior, link the affected services to integration tests, connection metrics, rollout thresholds, and the previous artifact. If a framework migration can change routing, link public endpoints to contract tests and traffic comparison. The map becomes operationally valuable when it shows not only what could be affected, but how the team will know and recover.
Keep the map current through execution
A blast-radius assessment decays as soon as code changes. Repositories gain dependencies, owners move, services are retired, and migration pull requests alter the paths being tracked. Rescan relevant commits continuously. Show added, removed, and changed findings, and recalculate downstream exposure. A closed blocker should disappear because its evidence changed, not because someone manually changed a status cell.
Use pull requests as change events. When a shared package changes, identify affected consumers and required validation before merge. When a new runtime pin appears, compare it with the target policy. When a service gains an external dependency, update its cutover gates. This shifts impact mapping from a one-time planning exercise to a control mechanism for the migration.
After cutover, compare predicted impact with observed outcomes. Which edges revealed real work? Which risks were overestimated? Which dependencies or owners were missing? Which tests detected issues, and which incidents escaped the planned gates? Feed those findings back into discovery rules and the graph model. The objective is not a perfect diagram; it is a system that becomes more reliable with each completed change.
Define stewardship for the model after the program ends. Repository relationships can refresh automatically, while ownership conflicts, external contracts, and business criticality need periodic review. Give teams a way to correct evidence without replacing it with unsupported assertions. A maintained impact graph reduces the cost of future upgrades because discovery starts from a tested structure and focuses attention on what changed.
A good impact map makes change explainable
Mapping migration blast radius requires more than repository search and more than a polished architecture picture. Define the change precisely, anchor the current state to immutable evidence, build a typed graph, trace dependencies in both directions, follow delivery and runtime paths, and add ownership, criticality, validation, and recovery. Preserve confidence and unknowns instead of smoothing them away.
When those elements connect, teams can answer the questions that determine migration success: where work belongs, what must move first, which shared component creates the greatest leverage, which service deserves the strictest gate, and how production failures will be contained. The resulting map is not documentation beside the plan. It is the foundation of the plan, the source of its sequence, and the evidence behind the cutover decision.
See the complete migration impact before work begins
CutoverGrid connects repositories, services, dependencies, owners, findings, migration waves, and cutover gates in one evidence-backed impact model.
Book a CutoverGrid demo Explore the product